Most merchants know their top-selling products. Far fewer can say where their orders actually go. “We ship all over the US” hides a lot of detail: maybe 40% of revenue lands in two metro areas, or a region you never advertise to quietly orders more than your target market.
That detail matters for fulfillment. It shapes where you keep stock, which shipping rates you offer, and which delivery promises you can keep in December. Shopify added interactive bubble maps to its analytics, which make this pattern easier to see. This guide explains how to read Shopify sales maps and turn them into practical fulfillment decisions. If you want to follow along in your own reports, you can open Shopify Analytics as you read.
What Shopify’s Sales Maps Show
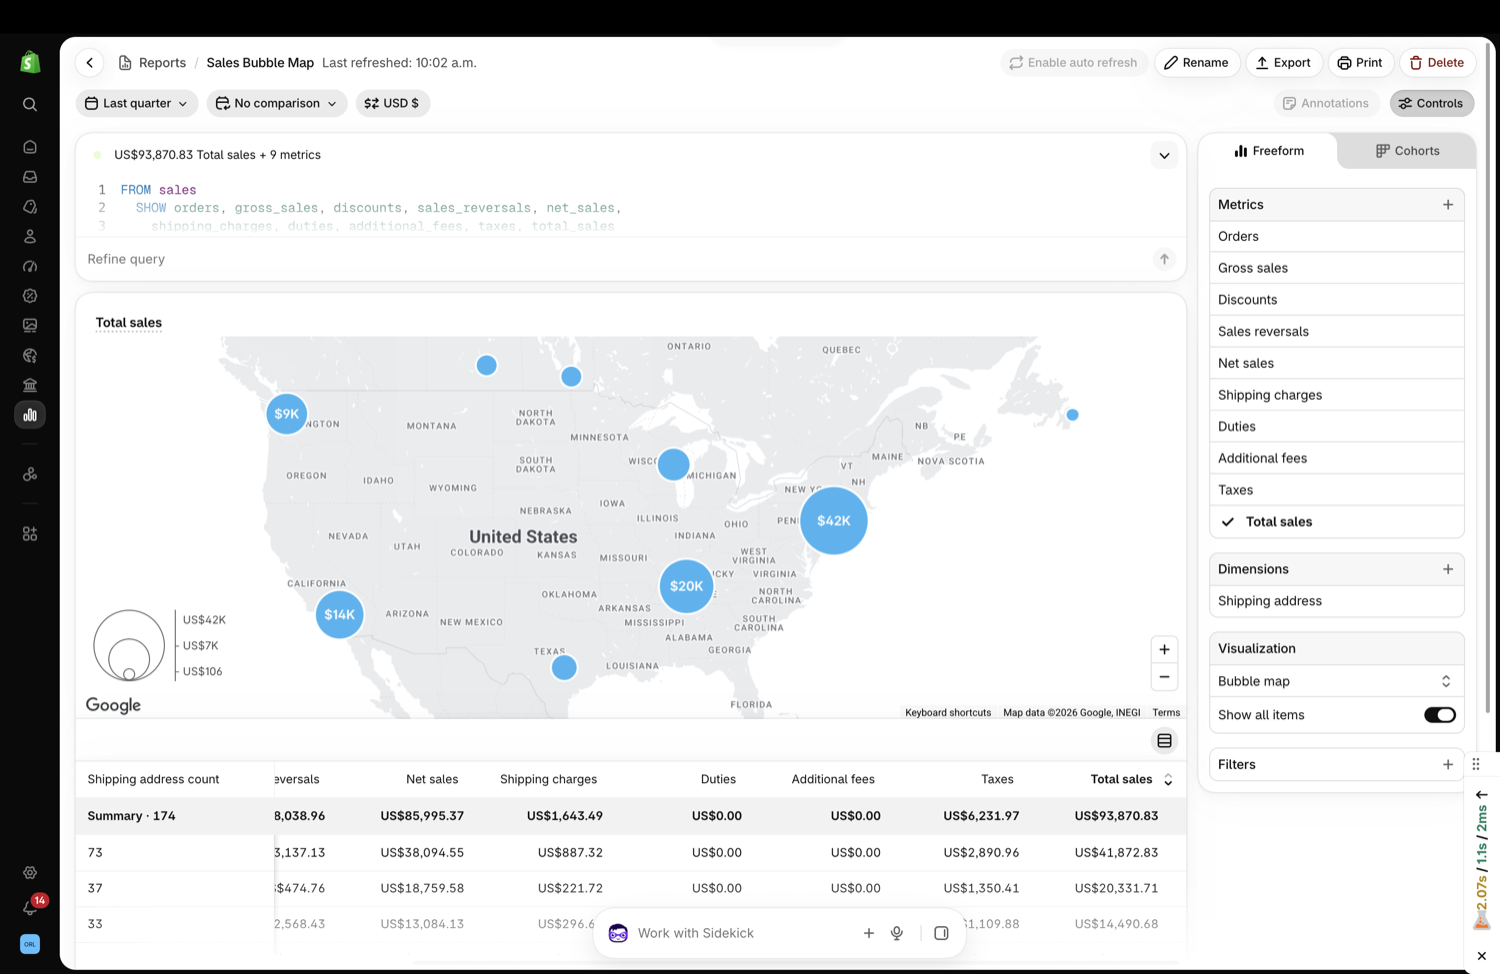
Shopify introduced zoomable bubble maps in analytics as part of its Fall ’26 updates.
Metrics you can plot
According to Shopify, bubble maps can show sales metrics such as net sales, gross sales, orders, average order value, or gross profit on an interactive map (Source: Shopify Blog).
Clusters based on addresses
Nearby shipping or billing addresses are grouped into clusters, and each bubble is sized by the metric you choose. That turns thousands of individual orders into a few readable hotspots.
Zoom for local detail
As you zoom or pan, the map and its supporting table update with more localized clusters. You can move from a country view down to regions and cities without building a custom report.
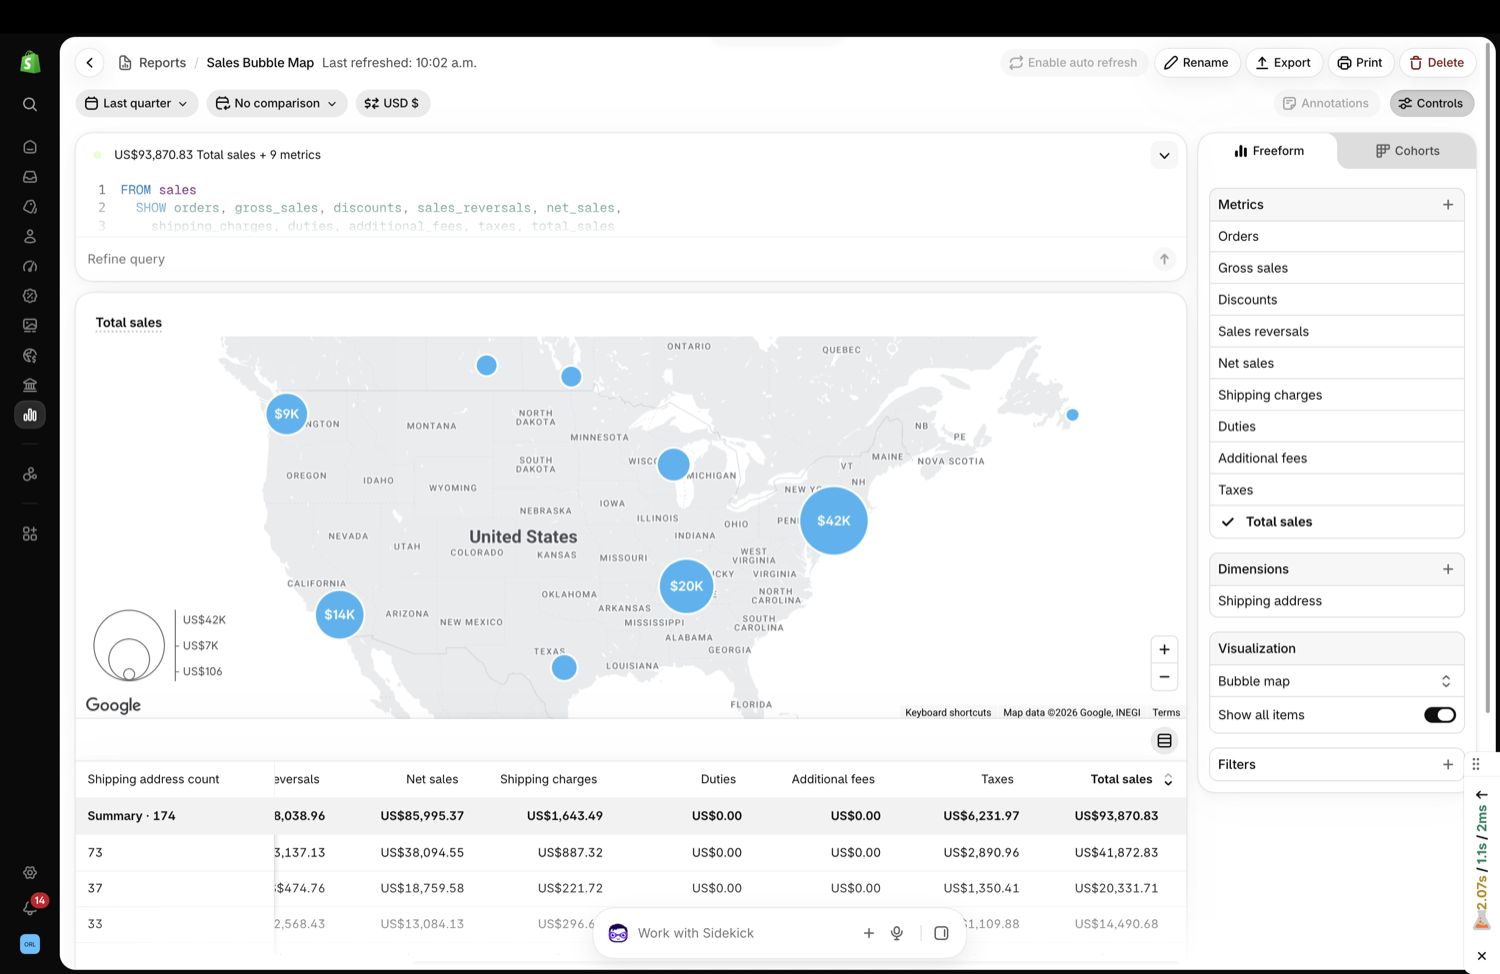
Image source: Shopify Blog.
Choose the Right View Before Deciding
The same map can tell different stories depending on which settings you choose.
Shipping address versus billing address
For fulfillment decisions, use shipping addresses. Billing addresses show where buyers live, which matters for marketing, but gifts and work deliveries often ship somewhere else, especially in December.
Orders versus revenue versus profit
Order count tells you where parcels go. Revenue shows where money comes from. Gross profit shows where orders are worth fulfilling. A region with many low-value orders may need a different shipping strategy than one with fewer, larger orders.
Time range
Compare a normal quarter with last year’s holiday period. Seasonal demand often concentrates differently, for example toward cities where people buy gifts for family elsewhere.
Using Hotspots for Inventory Placement
If you ship from more than one location, or are considering it, sales maps give you evidence instead of assumptions.
Compare hotspots with your warehouse locations
If your stock sits on the West Coast and your largest cluster is in the Northeast, many orders travel across the country. That often means slower delivery and higher shipping costs.
Test a second location with best-sellers only
You do not need to split your full catalog. Placing your top-selling products closer to your biggest cluster can shorten delivery for most orders while keeping inventory complexity manageable.
Check whether the pattern is stable
Before committing to a new location, confirm the hotspot appears across several months, not just during one campaign. A single viral post can create a temporary cluster.
| What the map shows | Possible fulfillment action | Check before acting |
|---|---|---|
| One dominant region far from stock | Test a second stock location for best-sellers | Pattern holds across several months |
| Many low-value orders in remote areas | Review shipping rates and free-shipping thresholds | Real shipping cost per order |
| High-profit cluster near a city | Offer faster delivery options there | Carrier coverage and cost |
| Growing cluster you never targeted | Regional campaign or local delivery test | Why demand is growing |
Partnered with Shopify: This guide includes Shopify links for merchants using analytics to plan shipping and inventory.
Shipping Rates and Delivery Promises
Sales maps also help you set realistic shipping offers.
Set delivery promises by region
A single “ships in 3 to 5 days” promise may be true for nearby regions and false for distant ones. Use your hotspot data to set region-specific estimates you can actually meet.
Review free-shipping thresholds by distance
If many small orders ship long distances, a single free-shipping threshold may cost more than you think. Calculate actual shipping cost per order for each major cluster.
Plan holiday cutoffs per zone
Shipping cutoffs for Christmas delivery depend on distance and service level. Knowing where most orders go helps you publish cutoff dates that cover the majority of your customers.

Image source: Unsplash.
Numbers to Pair With the Map
A map shows where demand sits, but it does not show cost. Pair it with a few simple numbers before making any fulfillment change.
Shipping cost per order by region
Pull your carrier invoices or shipping label costs and group them by the same regions you see on the map. If the largest cluster is also the most expensive to reach, that is the clearest signal that stock placement deserves a closer look.
Delivery time by region
Compare promised delivery times with actual delivery times for each cluster. A region with frequent late deliveries is a risk during December, when late parcels turn into refund requests and support tickets.
Return rate by region
Returns cost money twice, once in outbound shipping and again in the return. If one region has a much higher return rate, check whether delivery times, sizing, or product expectations differ there before you invest in serving it faster.
Repeat purchase rate by region
A cluster that orders once and never returns is worth less than a smaller cluster of loyal customers. Use repeat purchase data to decide which regions deserve faster delivery or local options.
Together, these four numbers turn a visual pattern into a decision you can defend. Keep them in one simple sheet next to screenshots of the map so the comparison is easy to repeat next quarter.
When Maps Point to Marketing Opportunities
Fulfillment and marketing decisions often come from the same map.
Strong but unadvertised regions
If a region orders well without targeted ads, it may respond strongly to a modest regional campaign, especially if you can also promise faster delivery there.
Weak regions despite ad spend
If you advertise heavily in an area that barely appears on the map, review targeting, delivery times, and shipping costs for that region.
Local delivery or pickup
A dense cluster near your store or warehouse may justify local delivery or pickup options, which can reduce cost and offer a faster option during peak weeks.
Worked Example: A Home Fragrance Brand
A candle brand ships from a single warehouse in Arizona and assumes its customers are spread evenly across the US.
What the map shows
Looking at last quarter’s orders by shipping address, the team sees a large cluster in the Northeast and a smaller one in Texas. Gross profit per order is also higher in the Northeast, where shoppers tend to buy multi-candle sets.
What they decide
Instead of moving everything, they test placing their five best-selling scents with a fulfillment partner closer to the Northeast for the holiday season. They also update delivery estimates by region and publish separate Christmas cutoff guidance for East Coast and West Coast customers.
How they judge the result
After the season, they compare delivery times, shipping cost per order, and repeat purchase rates in the Northeast with the previous year. They can compare reports in Shopify Analytics for the same periods to see whether the change paid off.
Mistakes to Avoid With Sales Maps
Maps are easy to read and easy to misread.
- Using billing addresses for shipping decisions.
- Reacting to one campaign spike instead of a stable pattern.
- Looking only at revenue and ignoring shipping cost and profit.
- Moving full inventory when a best-seller test would answer the question.
- Forgetting that customer privacy rules still apply to location data you export.
Sales Map Review Checklist
Run this review once a quarter and before each peak season.
- View orders and gross profit by shipping address for the last quarter.
- Compare with the same period last year.
- Note the top three clusters and their distance from stock.
- Calculate shipping cost per order for each major cluster.
- Check delivery promises and cutoffs for those regions.
- Decide on one test, such as a second stock location or a regional campaign.
Document what you decide, then review shipping settings in Shopify so rates and promises match the plan.
Image source: Unsplash.
Final Thoughts
Shopify sales maps show where your orders actually go, which turns fulfillment decisions from guesses into evidence. Use shipping addresses, compare orders with profit, confirm that patterns are stable, and start with small tests such as placing best-sellers closer to your largest cluster. With Shopify Analytics, you can review the same maps each quarter and adjust inventory, shipping, and delivery promises as demand shifts.
FAQ
Which address should I use on Shopify sales maps for fulfillment planning?
Use shipping addresses, since they show where parcels actually go. Billing addresses are more useful for marketing analysis.
Can I map profit, not just sales?
Shopify says bubble maps can show metrics including net sales, gross sales, orders, average order value, and gross profit.
How often should I review sales hotspots?
Quarterly is a practical rhythm, plus a review before peak seasons when delivery promises and cutoffs matter most.
We only recommend tools we’ve tested and trust. This post may include affiliate links, meaning we may earn a commission if you choose to purchase – at no extra cost to you.