The BFCM weekend ends and the team has one number to celebrate: total sales. It is a useful number, but it cannot tell you whether the sale was worth repeating, which offers worked, or whether you just pulled December orders forward at a lower price.
A post-sale scorecard answers those questions. It looks at profit, customer mix, discount dependency, refunds, stock, and fulfillment alongside revenue, and gives each area a simple rating. This guide shows what to measure after BFCM besides revenue and how to build the scorecard from your Shopify data. If you want to pull the numbers as you go, you can open your Shopify reports alongside this article.
Why Revenue Alone Is Not a Verdict
Revenue tells you how much people bought. It does not tell you what the sale cost or what it built.
Scale hides problems
Shopify reported a record $14.6 billion in merchant sales over the 2025 BFCM weekend (Source: Shopify). At that kind of volume across the platform, small issues in individual stores, such as a slightly too-deep discount, become large dollar amounts.
Timing hides cannibalization
Some BFCM orders would have happened in December at full price. A sale that only moved those orders forward at a discount looks great on the weekend and weak over the quarter.
Returns arrive later
The true result of BFCM is not known until return windows close. A scorecard reviewed in two stages captures that.
The Scorecard Structure
Use a short list of metrics, each with a target set before the sale, and rate each one green, amber, or red.
| Area | Metric | Question it answers |
|---|---|---|
| Profit | Contribution margin after discounts, shipping, and ads | Did the sale make money? |
| Customers | New vs returning customer share | Did we grow the customer base? |
| Discounts | Share of orders using the deepest discount | How dependent were sales on the offer? |
| Order value | Average order value vs normal weeks | Did bundles and thresholds work? |
| Refunds | Refund rate on BFCM orders | How much revenue will come back? |
| Inventory | Sell-through and stock-outs | Did we buy the right stock? |
| Fulfillment | Orders shipped late | Could operations handle the volume? |
Image source: Unsplash.
Profit and Discount Metrics
These two areas decide whether you should repeat the same offer next year.
Contribution margin, not gross profit
Subtract product cost, shipping you paid, payment fees, packaging, and ad spend from net sales. Compare contribution per order with a normal week to see the real cost of the offer.
Discount depth by product
Use Shopify’s sales by discount reports to see which offers drove orders. If most orders used the deepest tier, consider whether a smaller discount would have converted almost as well.
Free-shipping cost
If you lowered the free-shipping threshold, compare shipping label costs with shipping revenue for the sale period. This is one of the most commonly overlooked BFCM costs.
Customer Metrics
BFCM is often justified as customer acquisition. The scorecard should test that claim.
New versus returning share
A sale driven mostly by existing customers may have given discounts to people who would have bought anyway. A healthy share of new customers supports the acquisition argument.
Cost to acquire each new customer
Divide sale-period ad spend by new customers acquired. Compare it with your normal acquisition cost.
Early repeat signals
Track whether BFCM’s new customers place a second order by the end of January. That is the first evidence of whether they were worth acquiring at a discount.
Partnered with Shopify: This guide includes Shopify links for merchants reviewing BFCM performance and reporting.
Inventory and Fulfillment Metrics
Operational results shape customer experience and next year’s buying plan.
Sell-through by product
Compare units sold with units available for each key product. High sell-through with stock-outs means you under-bought. Low sell-through means cash is tied up in leftover stock.
Orders shipped late
Count orders that missed your stated processing time. Late shipping during BFCM tends to create support tickets and refund requests in December.
Support volume
Track tickets per hundred orders and their main causes. Repeated questions about discounts or delivery point to messaging you can fix next year.
Annotate the Sale in Your Analytics
Next year’s team will thank you for recording what happened and when.
Shopify’s Fall ’26 analytics updates include annotations, which let you add markers to charts for events such as campaign launches (Source: Shopify Blog).
Mark start and end times
Add annotations for when the sale, emails, and major ads started and ended. This makes it easier to connect spikes in sales to specific actions.
Record problems as they happened
If the site slowed or a discount failed for an hour, note it. Without notes, unusual dips are easy to misread later.
Note external events
Competitor sales, weather, or carrier delays can affect results. Annotations keep that context next to the numbers.
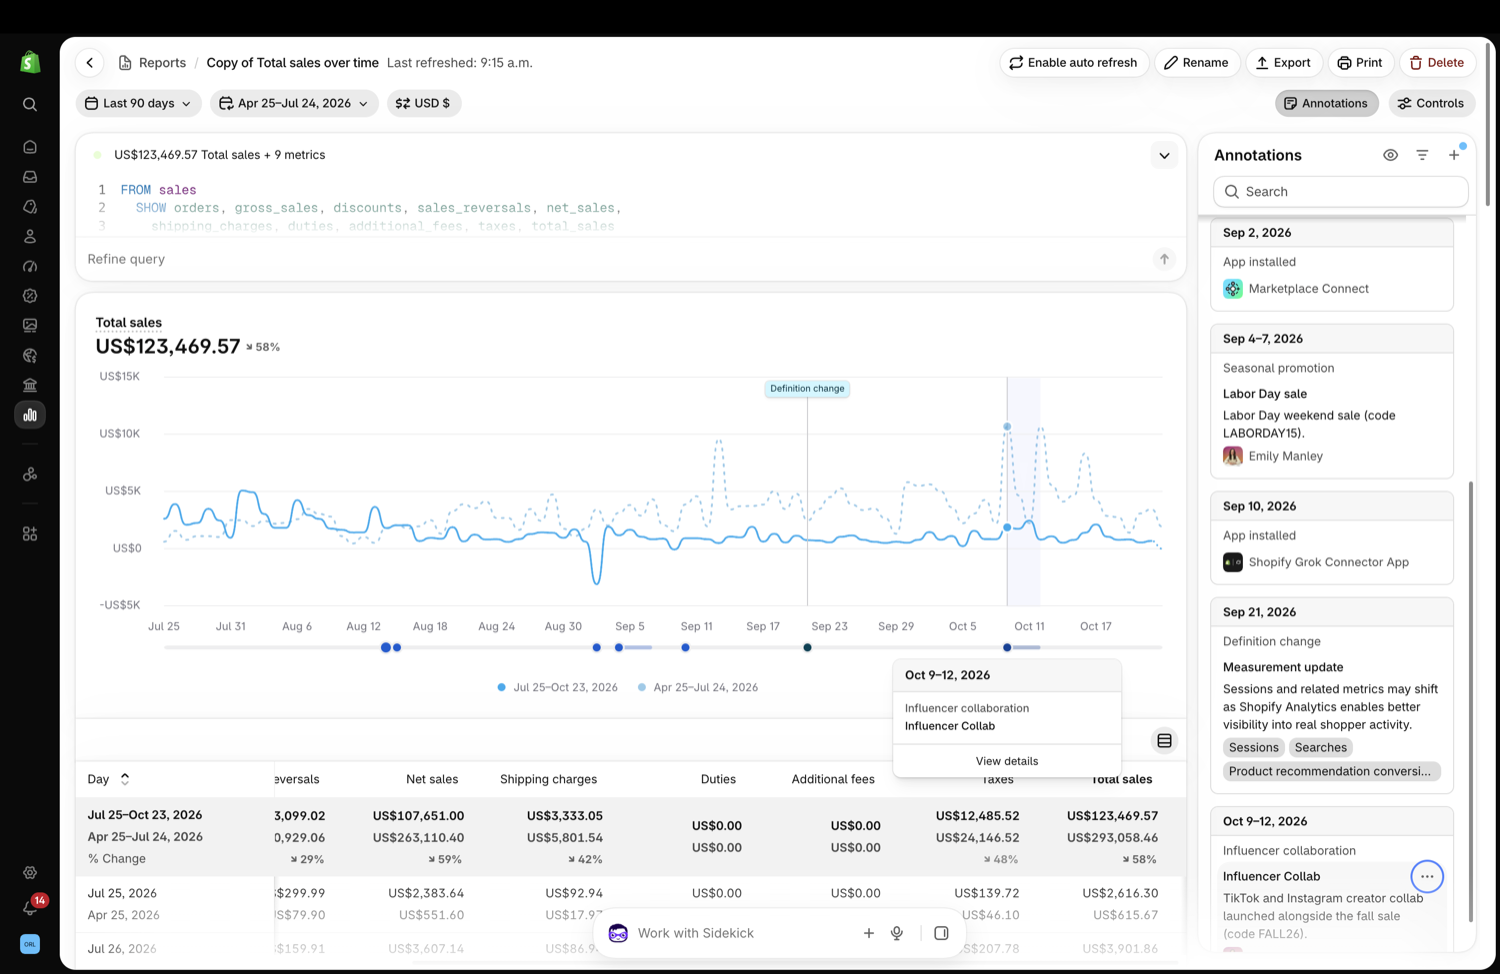
Image source: Shopify Blog.
Run the Review in Two Stages
Some metrics are ready in days, others need weeks.
First review in the week after Cyber Monday
Cyber Monday falls on November 30, 2026. In the first week of December, review revenue, contribution, discount usage, new customer share, sell-through, and shipping delays.
Second review after return windows close
In January, add refunds, repeat purchases, and gift card redemption if you offered them. Update the ratings with the final numbers.
Write three decisions
End each review with three concrete decisions for next year, such as “cap discounts at 20% on low-margin items” or “add a second packing shift on Black Friday.”
How to Set Fair Targets for Each Metric
A rating only means something if it is measured against a target you set honestly.
Use last year as the baseline where you can
If you ran BFCM last year, use those results as the starting point. Compare the same days, not the whole month, so the comparison reflects the sale itself.
Use a normal week when you have no history
New stores can compare BFCM with an average week in October. The comparison will show how much the sale changed order value, discount use, and shipping cost.
Define green, amber, and red in advance
For example, green might mean contribution per order stayed within 30% of a normal week, amber within 50%, and red anything worse. These thresholds are examples only. Set yours based on your margins and goals, and write them down before you look at the results.
Keep the number of metrics small
Seven to ten metrics are enough. A scorecard with thirty rows becomes a report nobody reads, and the decisions that matter get lost.
Share the Results With the Whole Team
A scorecard is most useful when the people who run the next sale can see it.
Keep it to one page
Put the ratings, three decisions, and a few notes on one page. Link to detailed reports for anyone who wants more.
Assign an owner to each decision
“Raise the free-shipping threshold” needs a person and a date. Without an owner, decisions from the review are easy to forget by next October.
Revisit it when planning starts
Open the scorecard when planning begins for the next BFCM, not the week before the sale. That gives enough time to change suppliers, staffing, or offers. You can save custom reports in Shopify so the same numbers are easy to pull again.
Example Scorecard Summary
Here is how a completed summary might read for a mid-size apparel store. The ratings are illustrative.
- Profit: Amber. Contribution per order fell more than planned because free shipping applied to many small orders.
- Customers: Green. A healthy share of orders came from new customers at an acceptable acquisition cost.
- Discounts: Red. Most orders used the deepest tier, suggesting the offer was deeper than needed.
- Inventory: Amber. Two bestsellers sold out on Saturday.
- Fulfillment: Green. Nearly all orders shipped on time.
Decisions: test a shallower discount with a bundle tier next year, raise the free-shipping threshold, and increase stock depth on the top two bestsellers.
Post-BFCM Scorecard Checklist
Use this list to complete the review.
- Set targets for each metric, ideally before the sale.
- Calculate contribution margin per order for the sale period.
- Review sales by discount and free-shipping cost.
- Measure new versus returning customers and acquisition cost.
- Check sell-through, stock-outs, and late shipments.
- Annotate key events in Shopify Analytics.
- Schedule a second review after return windows close.
- Write three decisions for next year.
Save the scorecard where next year’s team will find it, and compare it with next season’s Shopify reports when planning starts.

Image source: Unsplash.
Final Thoughts
What to measure after BFCM besides revenue comes down to profit, customer mix, discount dependency, refunds, inventory, and fulfillment. A simple post-sale scorecard with green, amber, and red ratings, reviewed once after the sale and again after returns, turns a record weekend into clear decisions for next year. Use Shopify’s reports and annotations to keep that record accurate and easy to revisit.
FAQ
When should I review BFCM results?
Do a first review in the week after Cyber Monday and a second one after return windows close in January.
What is the most important metric after BFCM?
Contribution margin per order is often the clearest single measure, because it includes discount, shipping, fee, and ad costs.
Can I mark BFCM events in Shopify Analytics?
Shopify’s Fall ’26 analytics updates include annotations that let you add markers for events such as campaign launches.
We only recommend tools we’ve tested and trust. This post may include affiliate links, meaning we may earn a commission if you choose to purchase – at no extra cost to you.